PowerMind Orchestrate User Guide
This page is the visual tour. Screenshots are from the live Studio Orchestrate UI.
Always check the project in the top bar (example: AI Project).
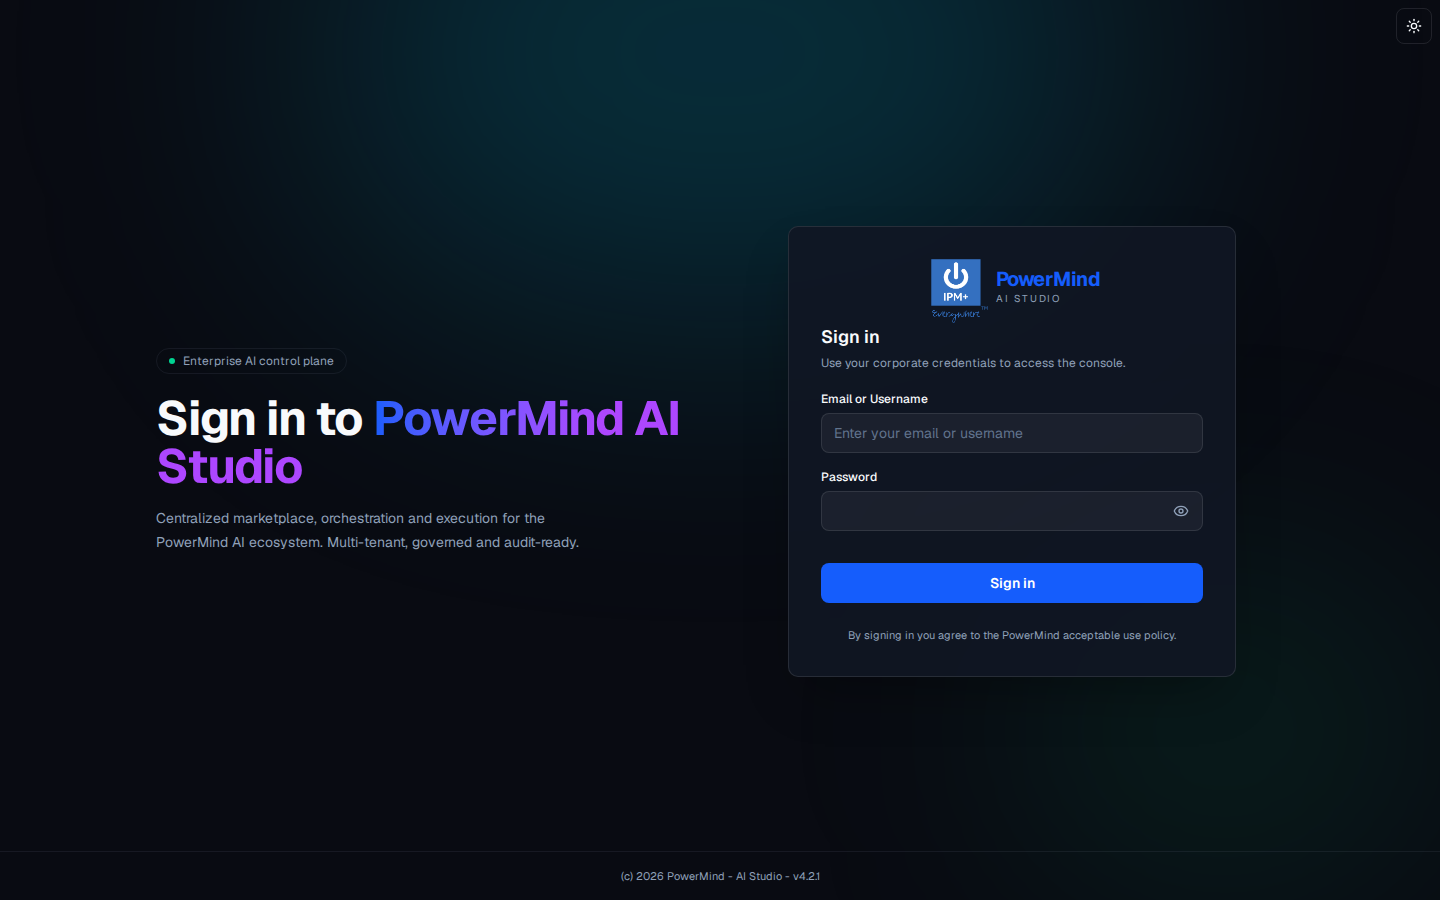
1. Sign in
Your company username/email and password. Theme toggle is the sun icon, top right.
2. Tool Marketplace (hub)
Left menu groups tools: MLOPS, DATAOPS, LLMOPS, AIAAS. Orchestrate is under DATAOPS. Filters: All, MLOps, LLMOps, DataOps, AIaaS.
Cards show Available (Launch) or Not enabled.
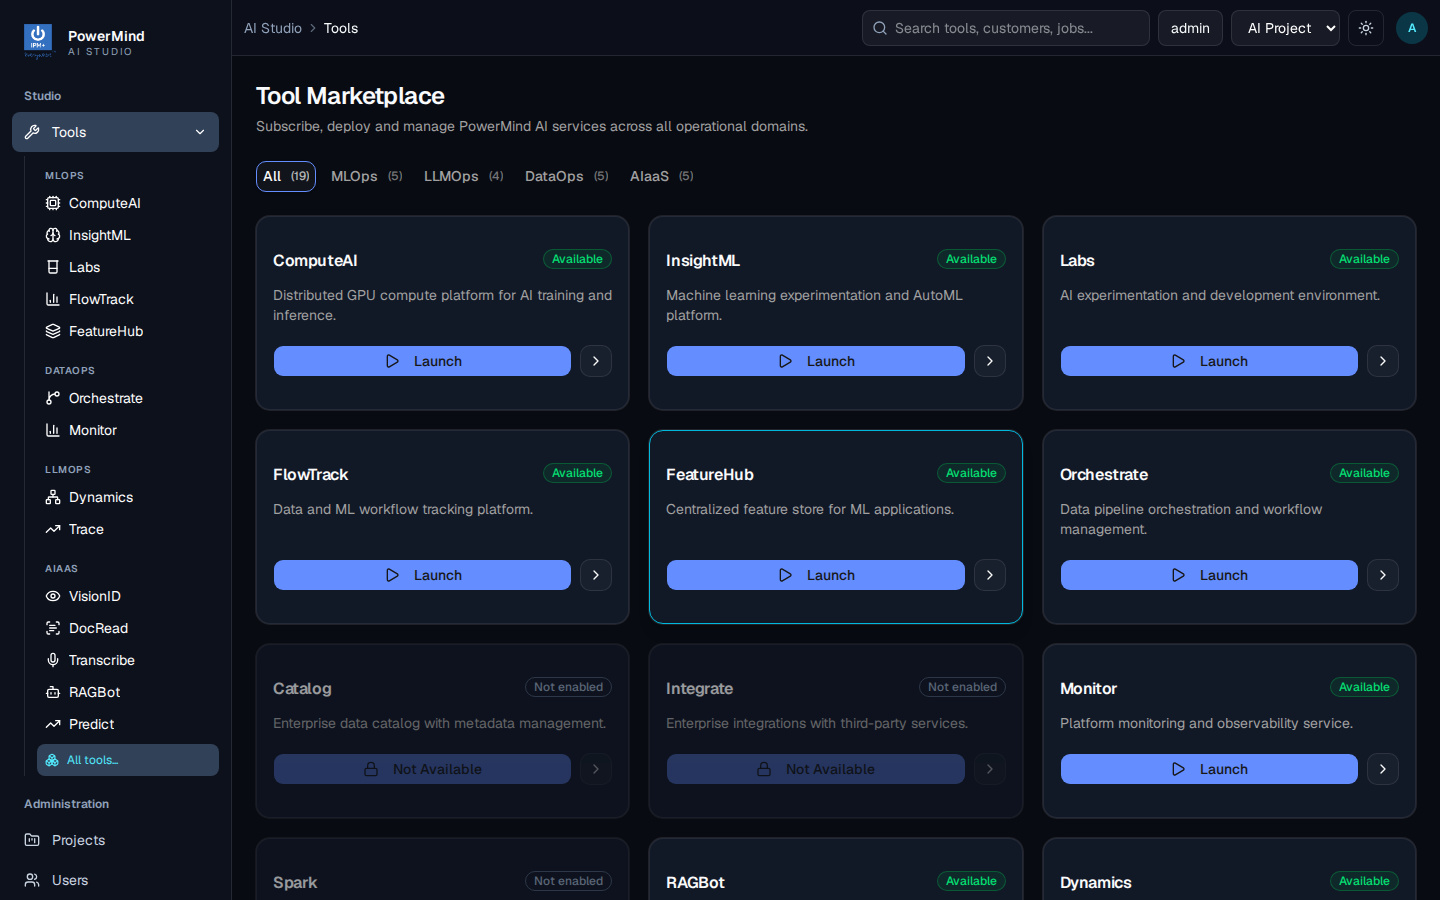
Open Orchestrate. Header: PowerMind Orchestrate — AI workflow orchestration & pipeline automation · AIaaS. Green Healthy means the API answered.
3. Pipelines
Tab: Pipelines. Breadcrumb: AI Studio > Tools > orchestrate > pipeline.
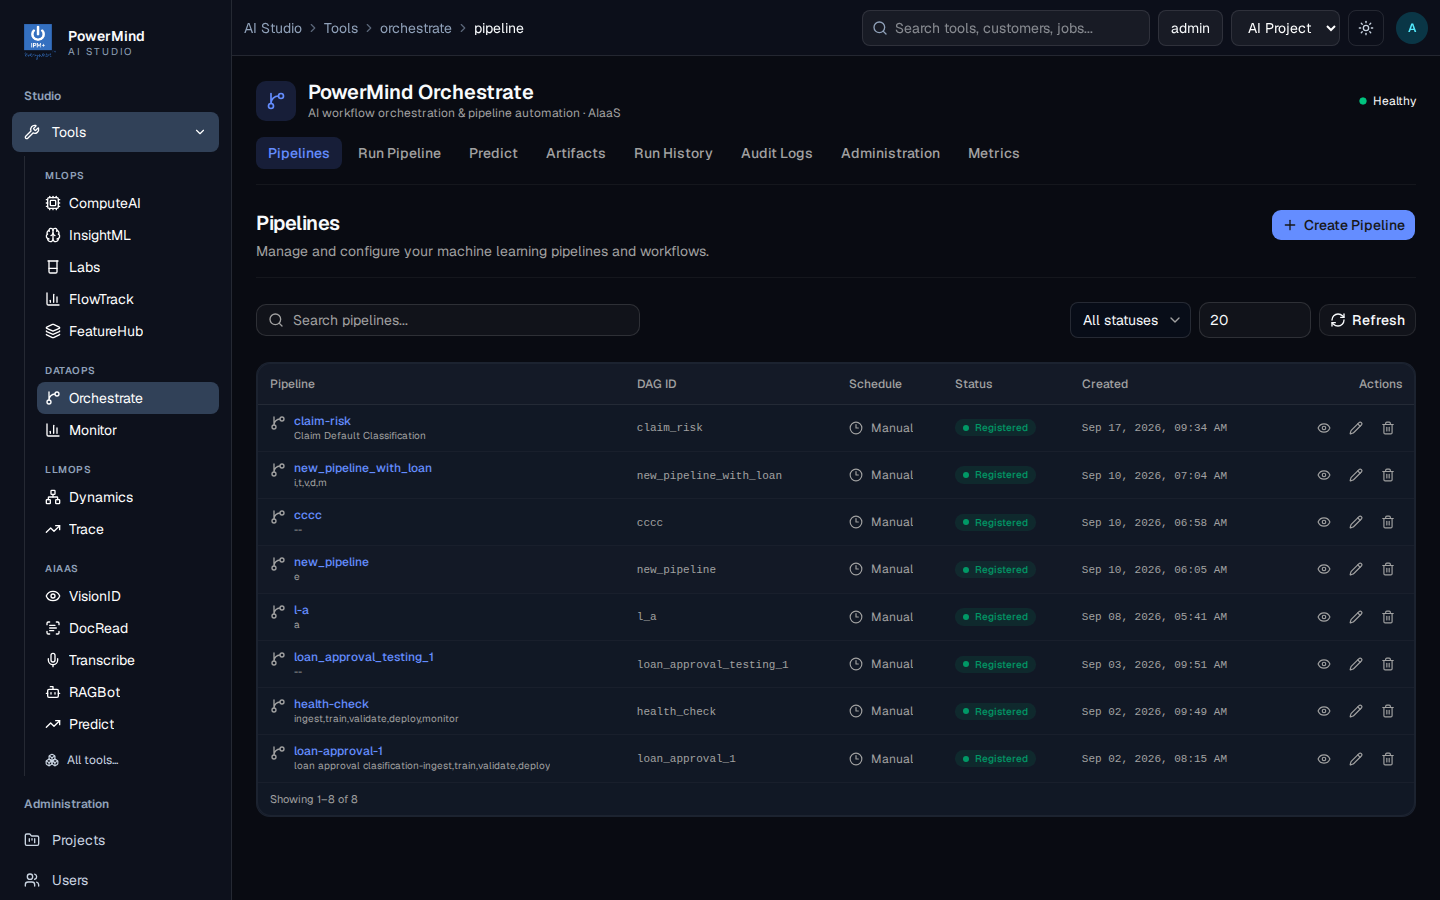
| Column | Meaning |
|---|---|
| Pipeline | Name + short description |
| DAG ID | Internal job name (usually matches the pipeline) |
| Schedule | Usually Manual |
| Status | Registered when ready |
| Created | Date |
| Actions | View, edit, delete |
+ Create Pipeline, Search pipelines..., status filter, Refresh.
4. Create Pipeline
The create dialog is a form.
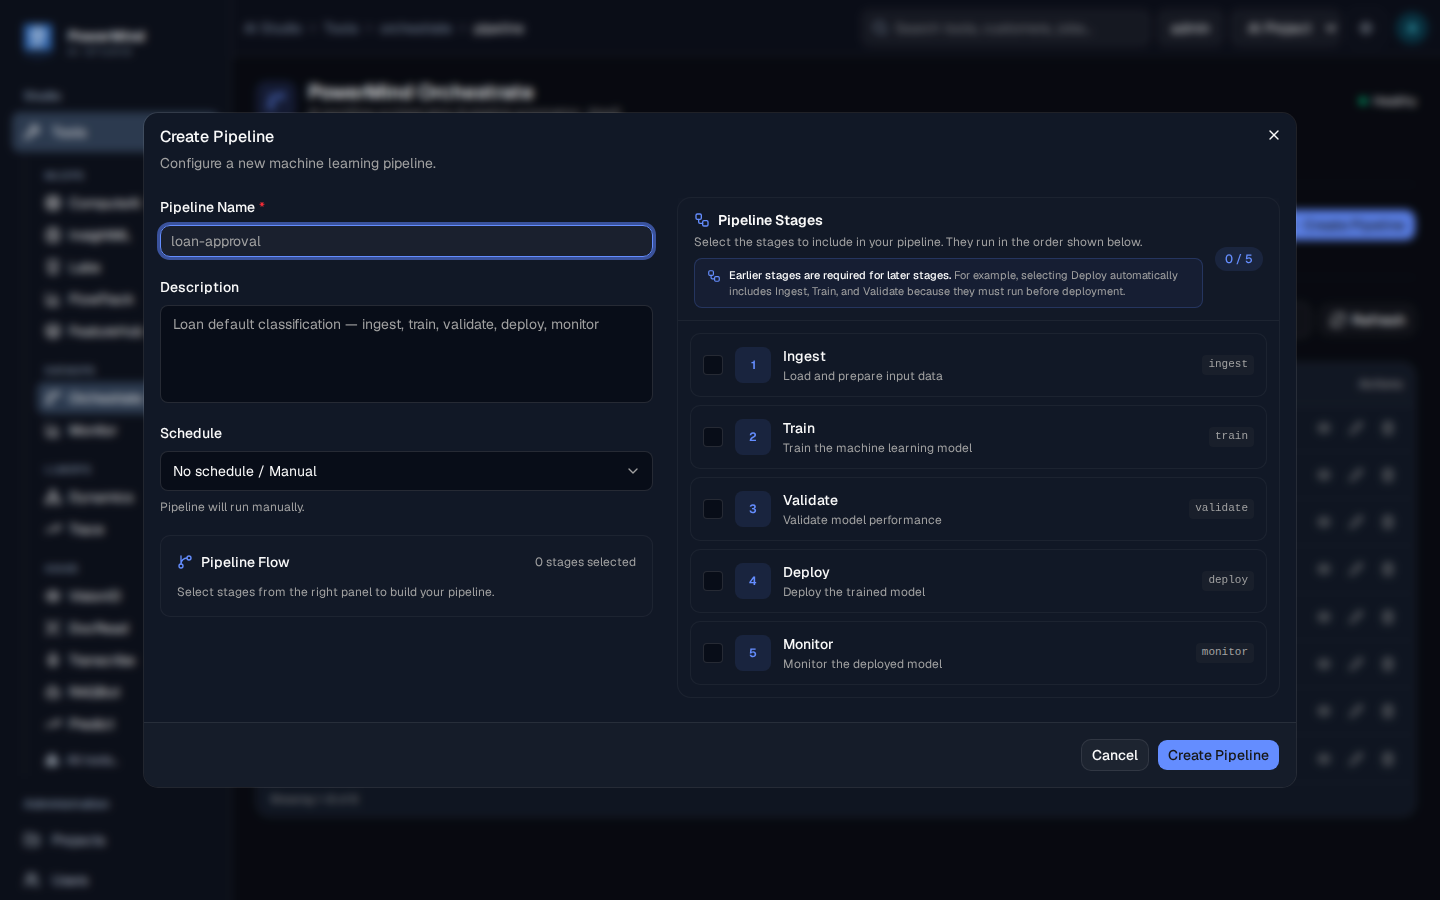
Left: name (required), description, schedule (No schedule / Manual).
Right — Pipeline Stages (run in this order):
- Ingest — load data
- Train — fit the model (
labelcolumn) - Validate — check performance
- Deploy — publish the model
- Monitor — write monitor metrics
Selecting a later stage also requires the earlier ones.
5. Run Pipeline
Tab: Run Pipeline. Breadcrumb: ... > orchestrate > run.
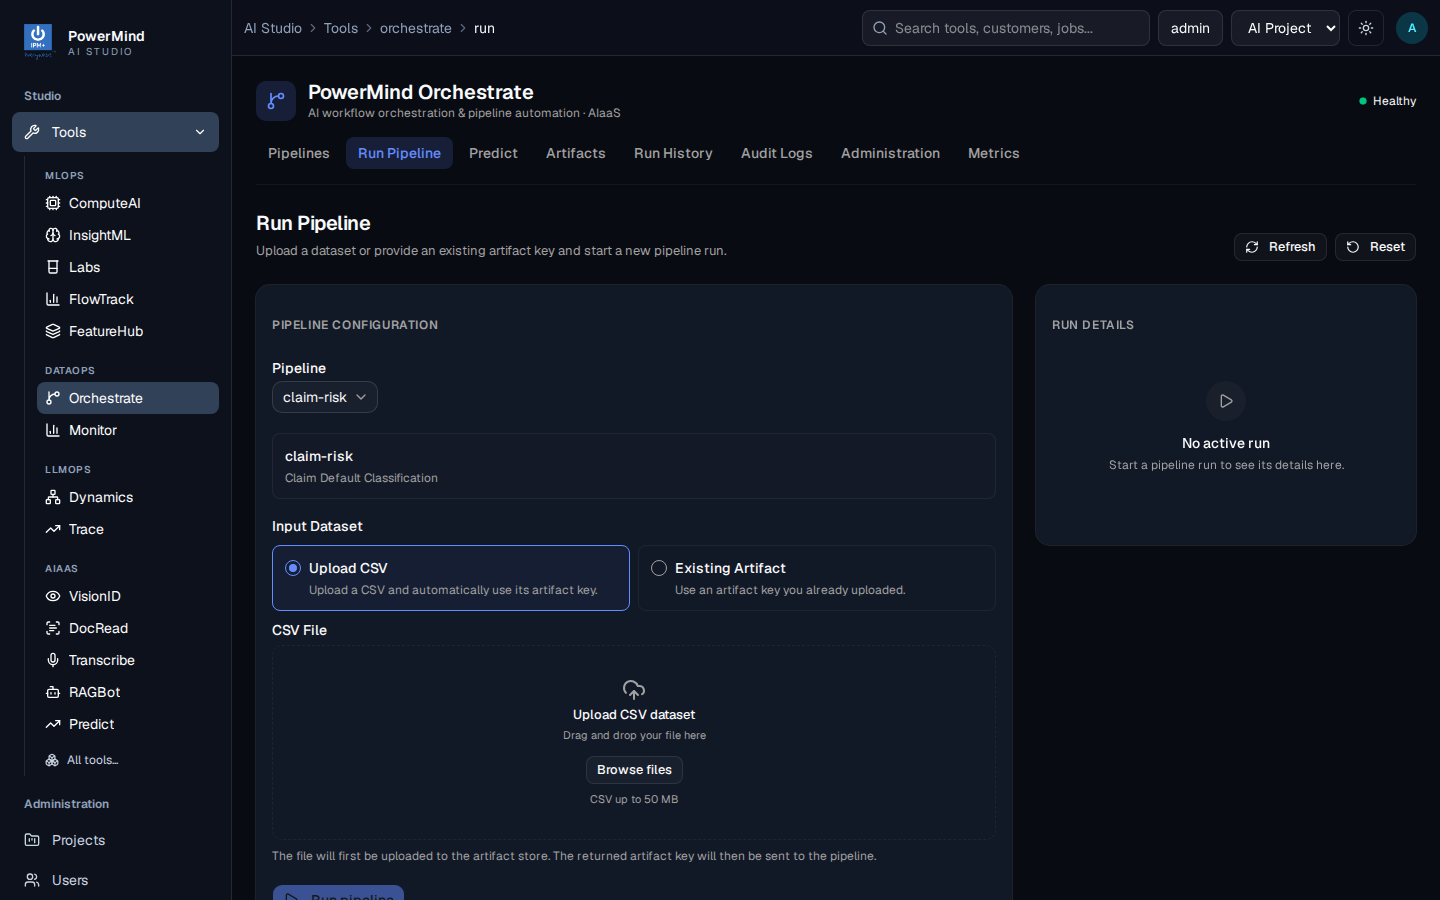
- Choose Pipeline.
- Upload CSV (drag-and-drop or Browse files, CSV up to 50 MB) or Existing Artifact.
- Start the run. RUN DETAILS on the right shows the active run (or No active run).
The file is stored as an artifact, then handed to the pipeline.
6. Predict
Tab: Predict. Breadcrumb: ... > orchestrate > predict.
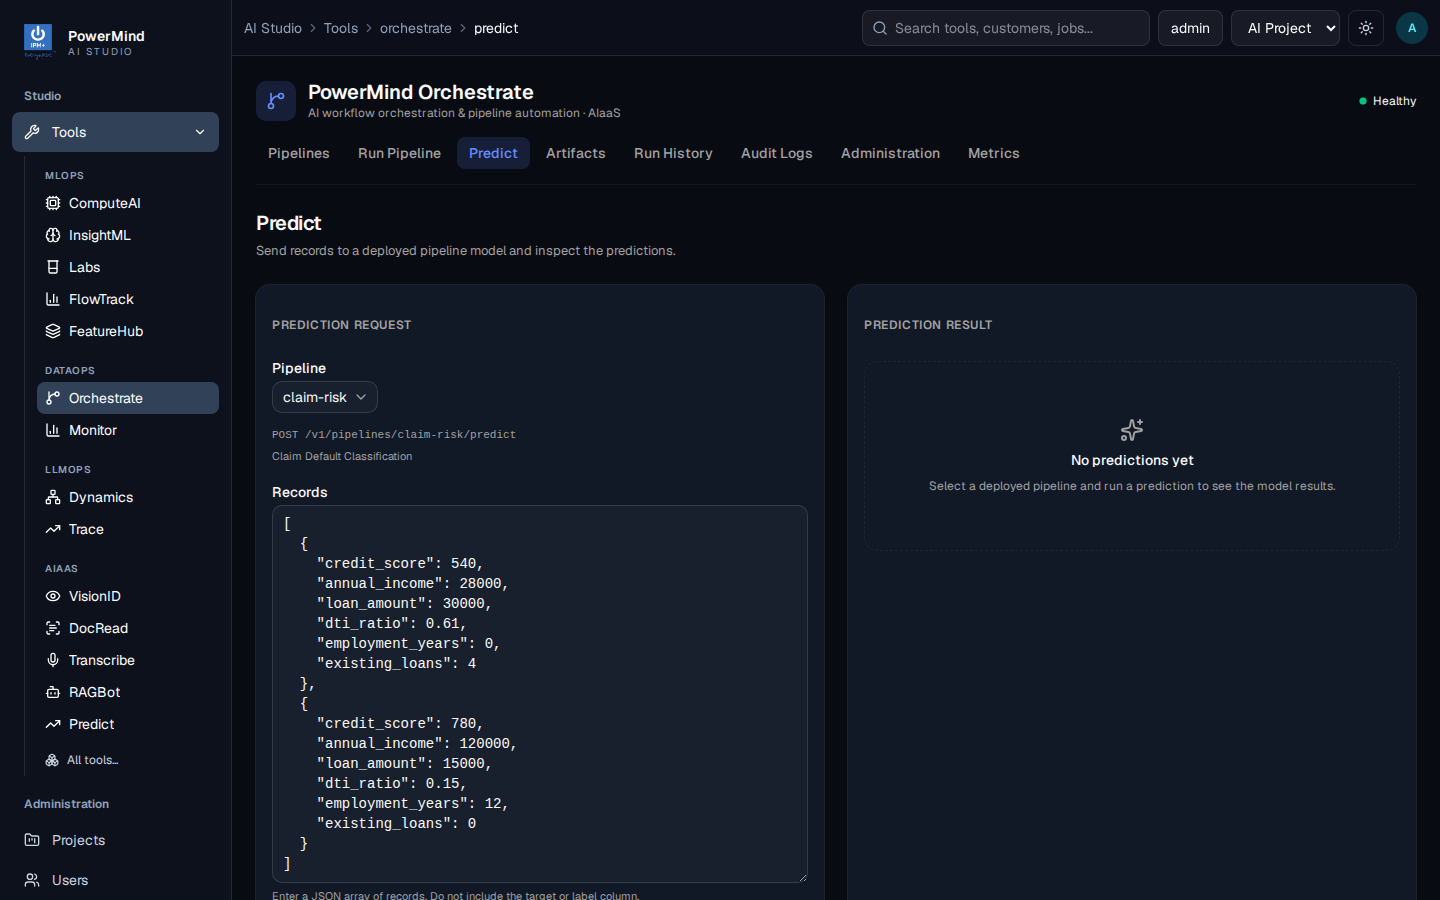
- Select a pipeline that already Succeeded with Deploy.
- Paste a JSON array of records. Do not include
label. - Feature names must match the training CSV (the editor may show a loan example — replace it if your model used other columns).
- Results appear under PREDICTION RESULT.
7. Artifacts
Tab: Artifacts. Breadcrumb: ... > orchestrate > artifact.
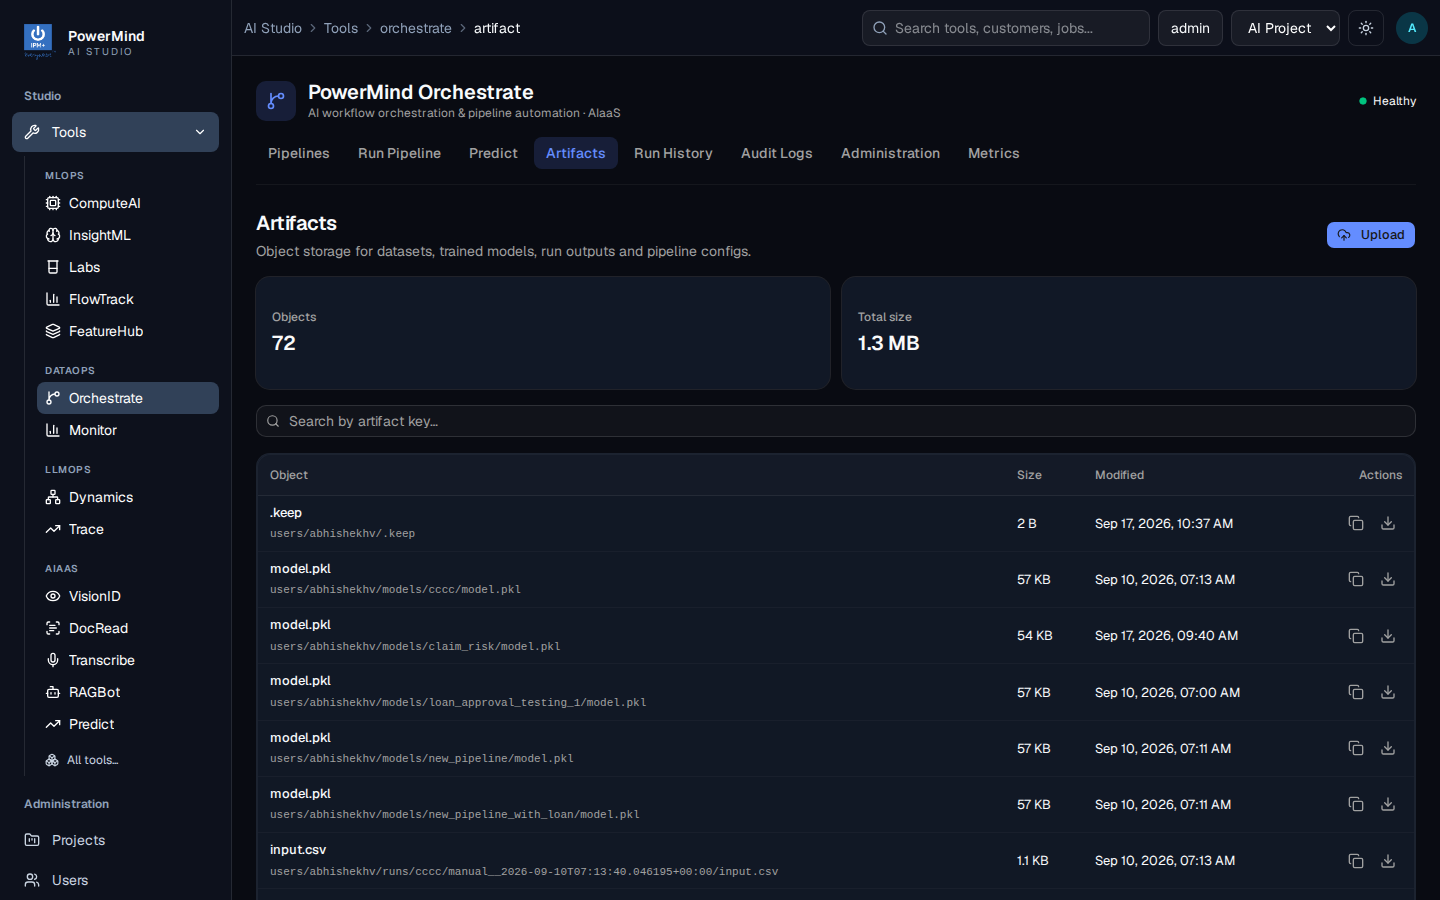
Object storage for datasets, model.pkl, run folders, and configs. Search by key; copy or download from Actions. Upload adds a file without starting a run.
Typical path: your user folder, then the pipeline name, then the model file.
8. Run History
Tab: Run History. Breadcrumb: ... > orchestrate > history.
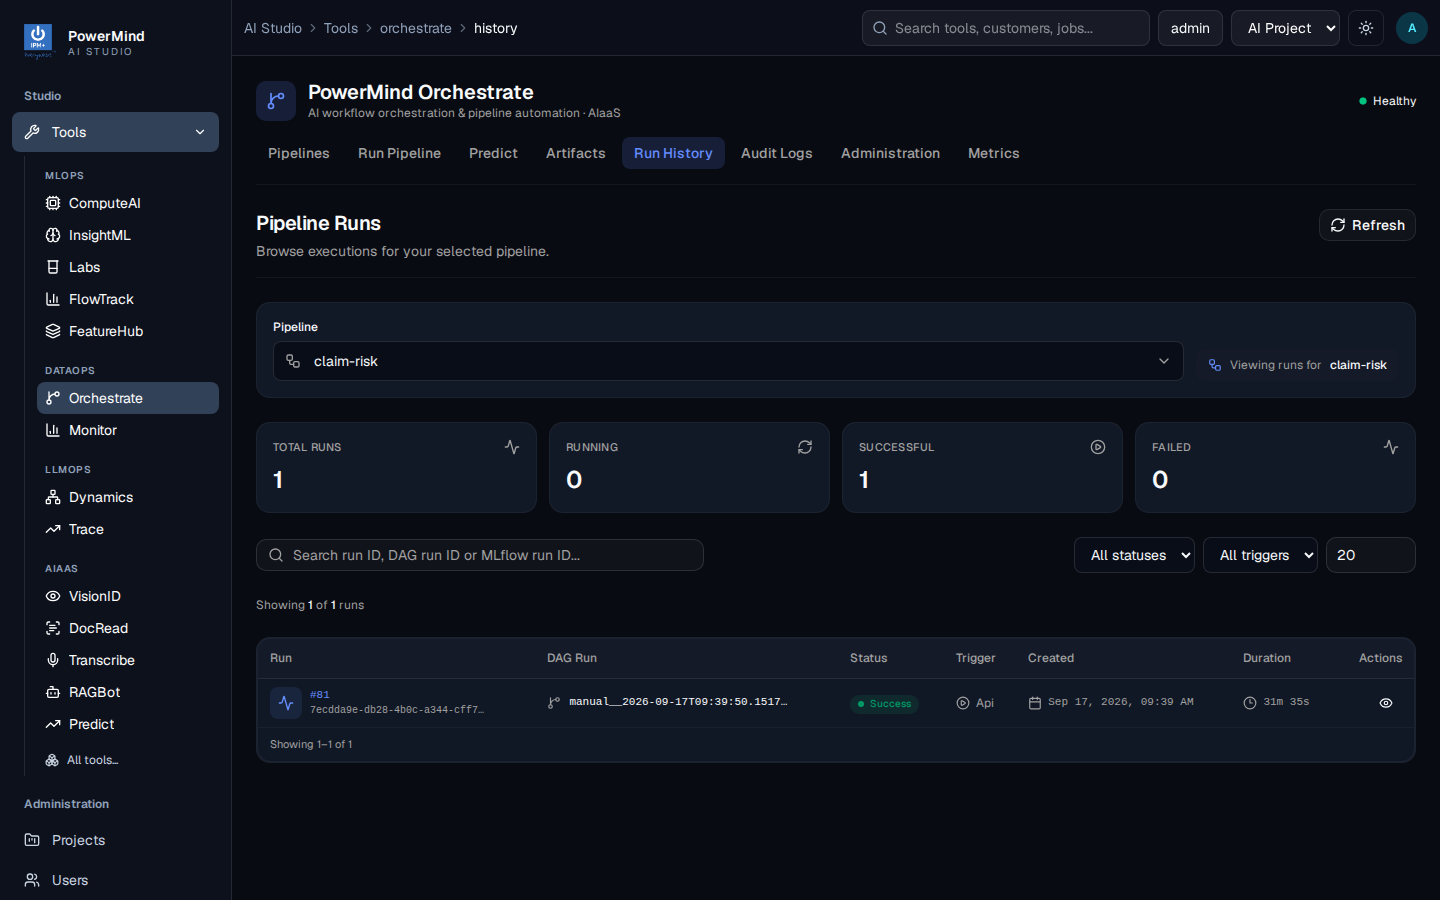
Pick a pipeline. Cards show total / running / successful / failed. Table: run id, DAG run, Success or fail, trigger, created time, duration.
9. Audit Logs
Tab: Audit Logs (inside Orchestrate — not Studio’s left-menu Audit Logs).
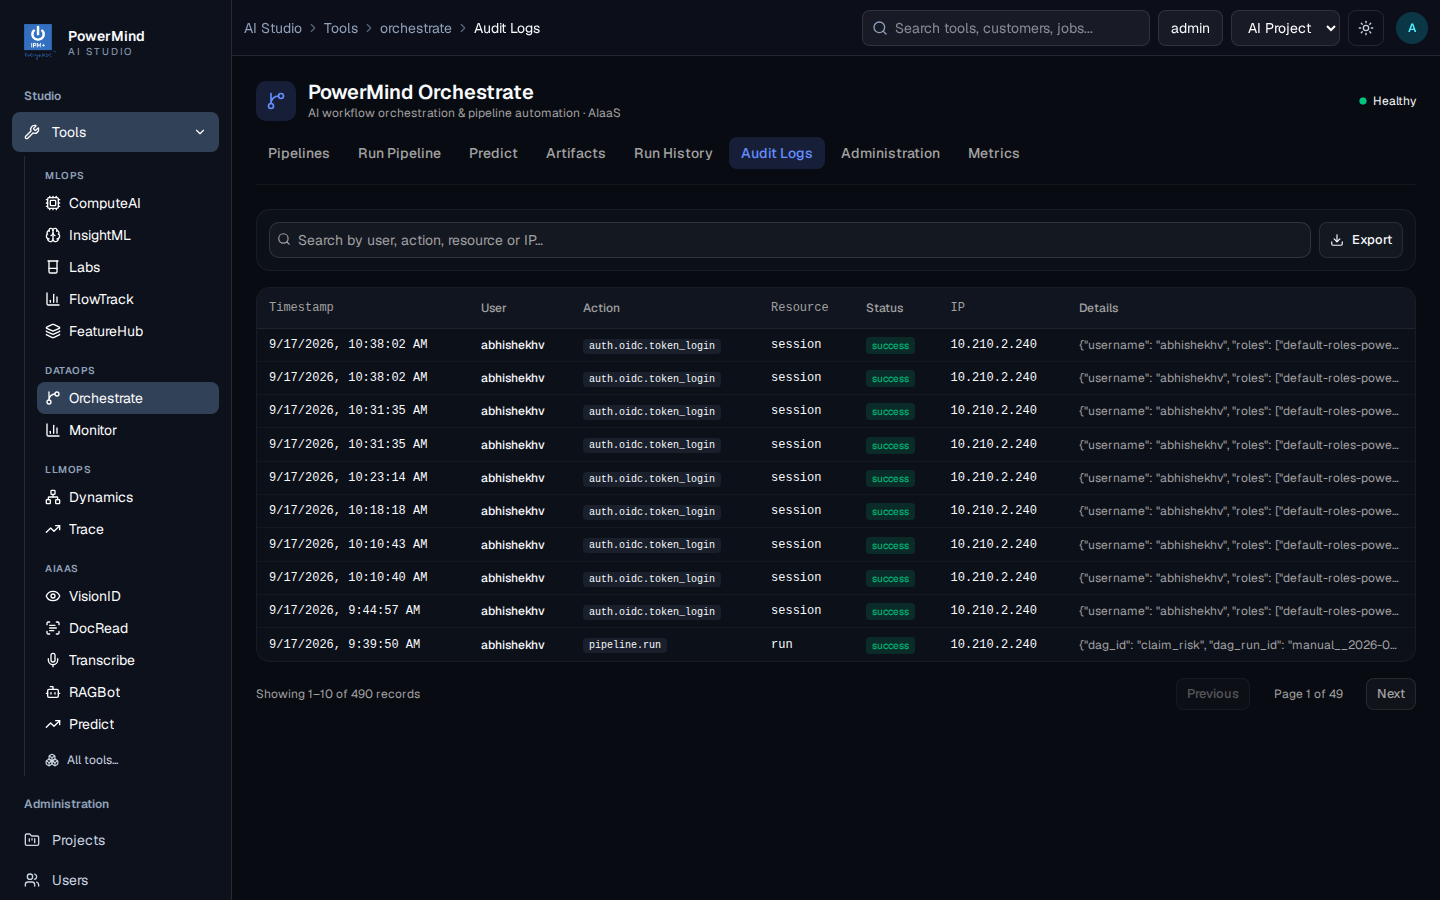
| Column | Meaning |
|---|---|
| Timestamp | When it happened |
| User | Login name |
| Action | Sign-in or pipeline run |
| Resource | session, run, … |
| Status | success / failure |
| IP | Client address |
| Details | Extra JSON |
Search and Export. Pagination at the bottom.
10. Administration
Tab: Administration. Breadcrumb: ... > orchestrate > administration.
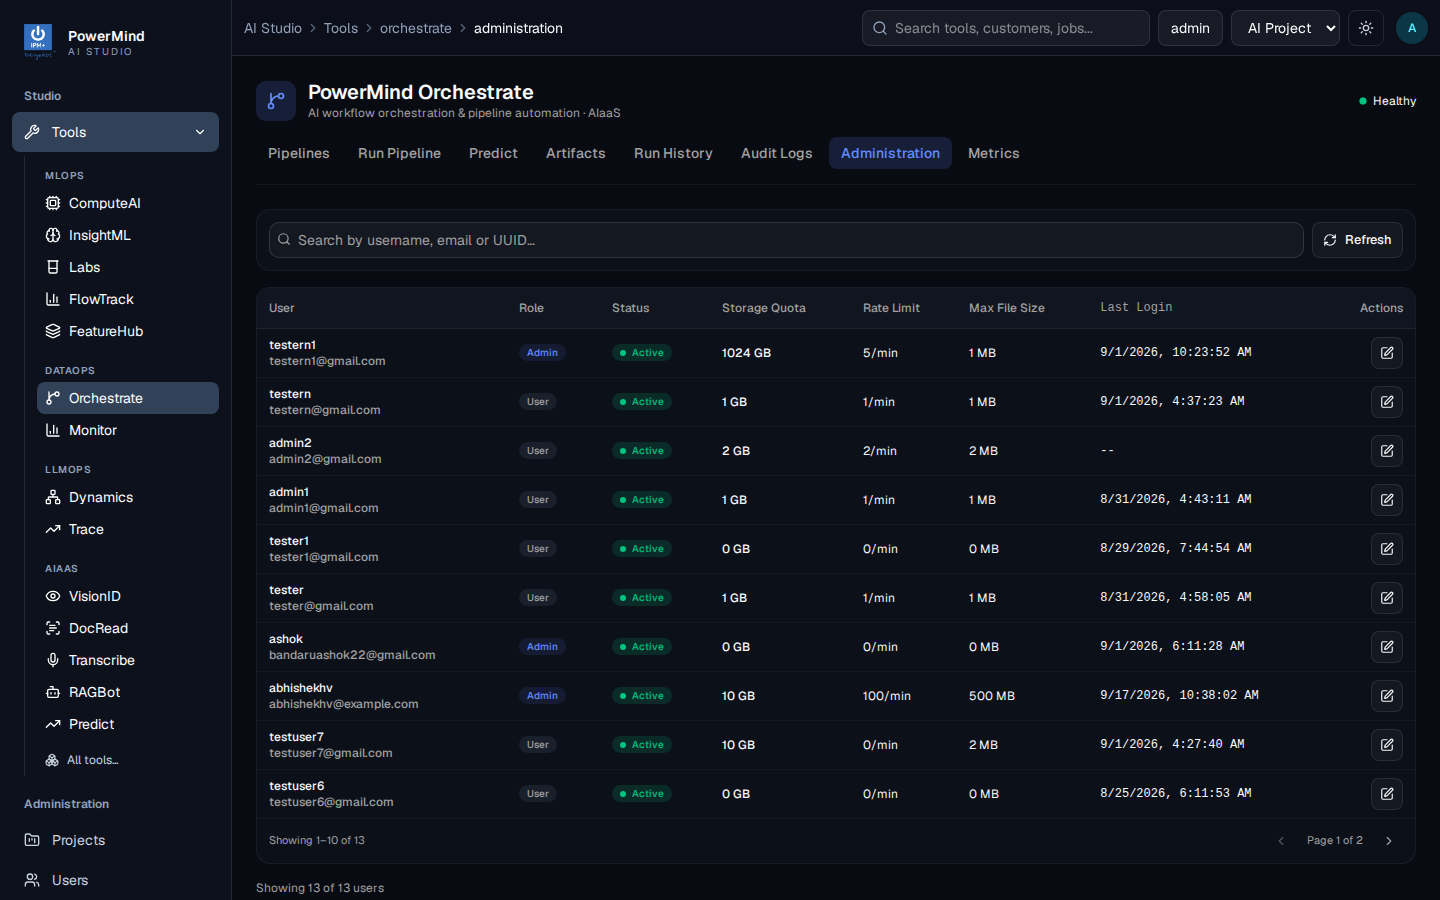
Orchestrate users: role, status, storage quota, rate limit, max file size, last login. This is not the Studio Users page under the left menu.
11. Metrics
Tab: Metrics. Breadcrumb: ... > orchestrate > metrics.
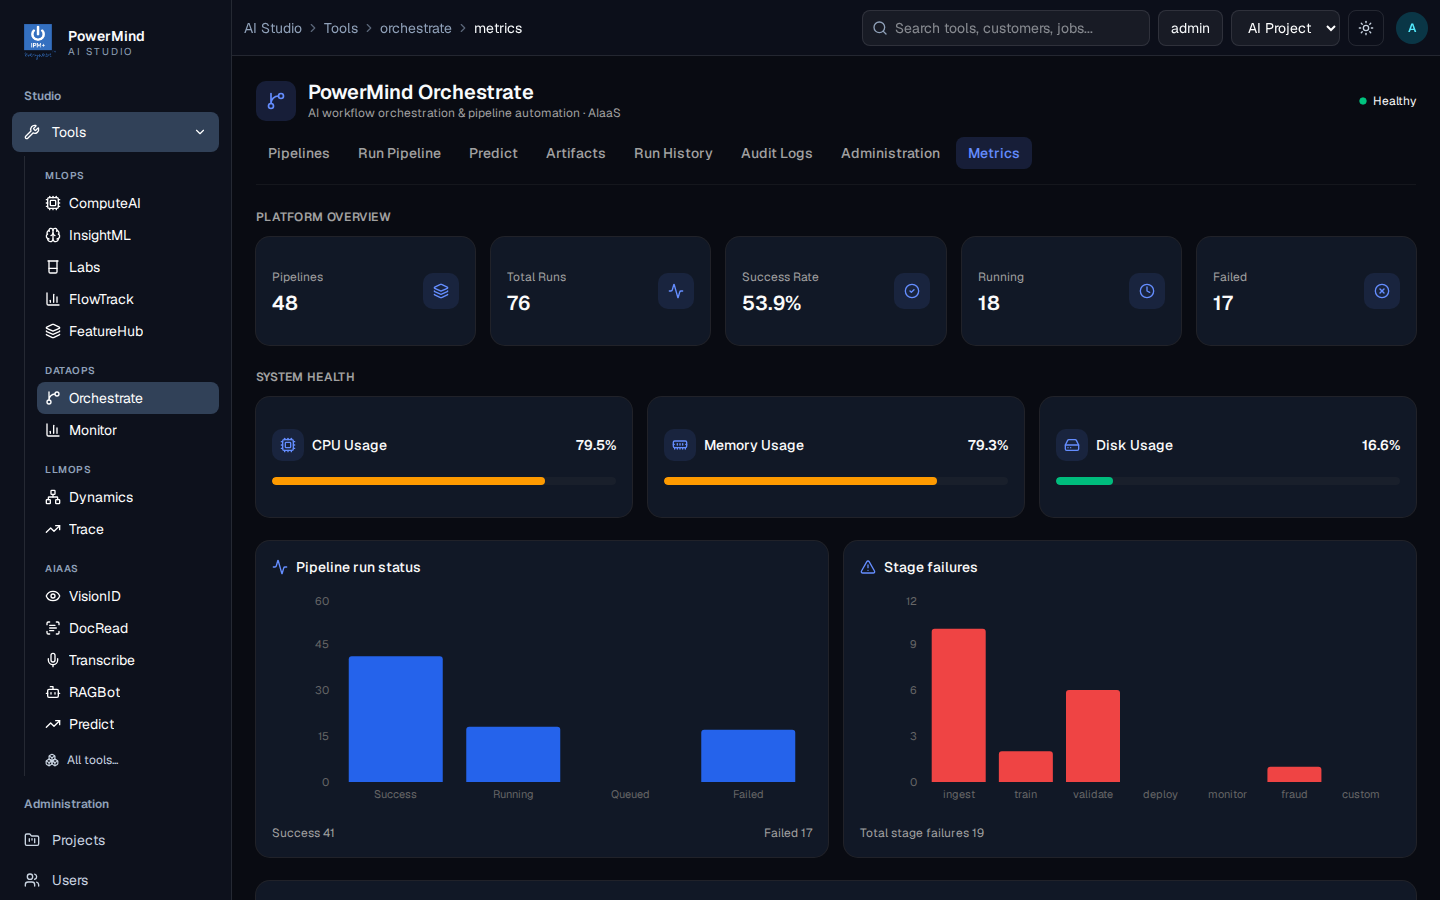
Platform overview (pipelines, runs, success rate, running, failed), system health (CPU, memory, disk), pipeline run status, and stage failures.
12. Swagger (API console)
For developers. Open /docs on the Orchestrate API host. Authorize with a Bearer token, then try endpoints.
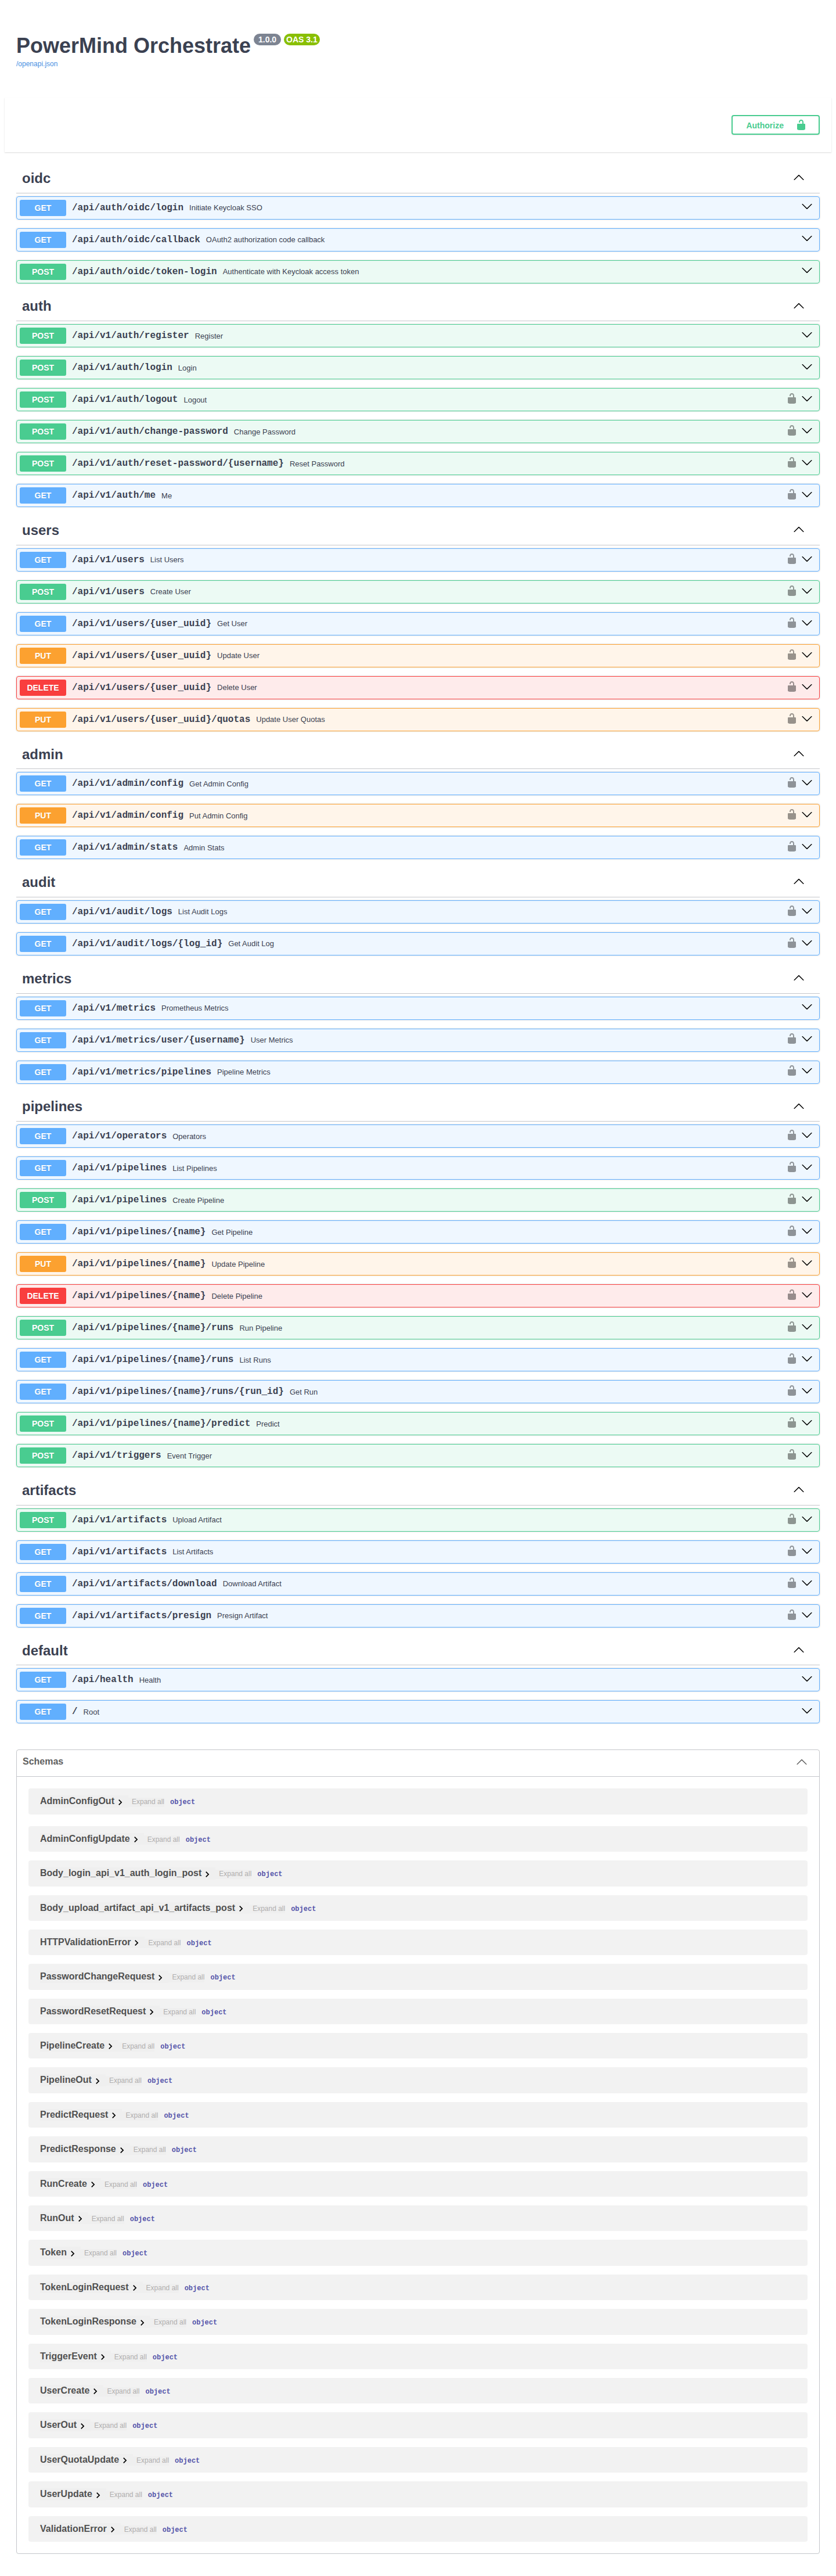
Details: API reference.