PowerMind Trace User Guide
Real-world use case
Persona: Ilya, an engineer debugging LLM agent traces in Studio after Dynamics / AIFlow turns. A support agent returned a weak answer and burned unexpected tokens. She signs into PowerMind AI Studio, launches Trace from the Tool Marketplace, finds the conversation under Sessions, drills into the root span on Traces, then runs a rubric on Evaluations before shipping a prompt fix.
flowchart LR
  A[Dynamics / AIFlow turn] --> B[Traces land in Trace project]
  B --> C[Sign in to PowerMind AI Studio]
  C --> D[Select Studio project]
  D --> E[Tool Marketplace -> Launch Trace]
  E --> F{Which tab?}
  F -->|Traces| G[Search / open detail sheet<br/>attrs / input / output]
  F -->|Sessions| H[Find conversation<br/>open Traces with Session filter]
  F -->|Evaluations| I[Select rubric -> Run eval<br/>review Score / Label]
  G --> J[Root-cause & fix prompt]
  H --> G
  I --> J
UI module quick reference
| Module | Route | What you do here |
|---|---|---|
| Login | /login |
Sign in with Email or Username and Password |
| Tool Marketplace | /app/tools |
Browse tools; open the Trace card and Launch |
| Trace -- Traces | /app/tools/trace |
List traces, search, refresh, open detail sheet |
| Trace -- Sessions | /app/tools/trace/sessions (/sessions under Trace) |
List sessions; open into Traces with a Session filter |
| Trace -- Evaluations | /app/tools/trace/evaluations (/evaluations under Trace) |
Pick rubric & window, Run eval, review scores |
| Control / label | Where | Purpose |
|---|---|---|
| Sign in to PowerMind AI Studio | Login | Page heading |
| Email or Username / Password / Sign in | Login | Credentials and submit |
| Tools | App sidebar | Navigate to tools / marketplace |
| Tool Marketplace | /app/tools |
Hub H1 |
| Domain tabs All / MLOps / LLMOps / DataOps / AIaaS | Marketplace | Filter tool cards |
| Trace card: Prompt tracing and token analytics for LLMs. | Marketplace | Identify Trace |
| Launch | Trace card | Open Trace UI |
| Trace H1 + subtitle | Trace shell | Trace project explorer for traces, sessions, annotations, and evaluations. |
| Tabs Traces | Sessions | Evaluations | Trace shell | Switch Trace views |
| Select Trace project... | All Trace tabs | Choose the Trace project |
| Search traces... / Refresh | Traces | Filter and reload |
| Columns Trace | Agents | Root Span | Start | Duration | Tokens | Traces table | At-a-glance telemetry |
| Detail sheet attrs / input / output | Trace detail | Inspect span attributes and I/O |
| Search sessions... / Delete Selected | Sessions | Find or remove sessions |
| Columns Session | Start Time | End Time | Sessions table | Session timeline |
| All agents / Select rubric / Last 10-50 / Run eval | Evaluations | Configure and execute scoring |
| Columns Rubric | Agent | Trace | Label | Score | Latency | When | Evaluations table | Result grid |
1. Sign in to PowerMind AI Studio
1.1 Open the login page
- In your browser, open PowerMind AI Studio.
- You should land on
/loginwith the heading Sign in to PowerMind AI Studio.
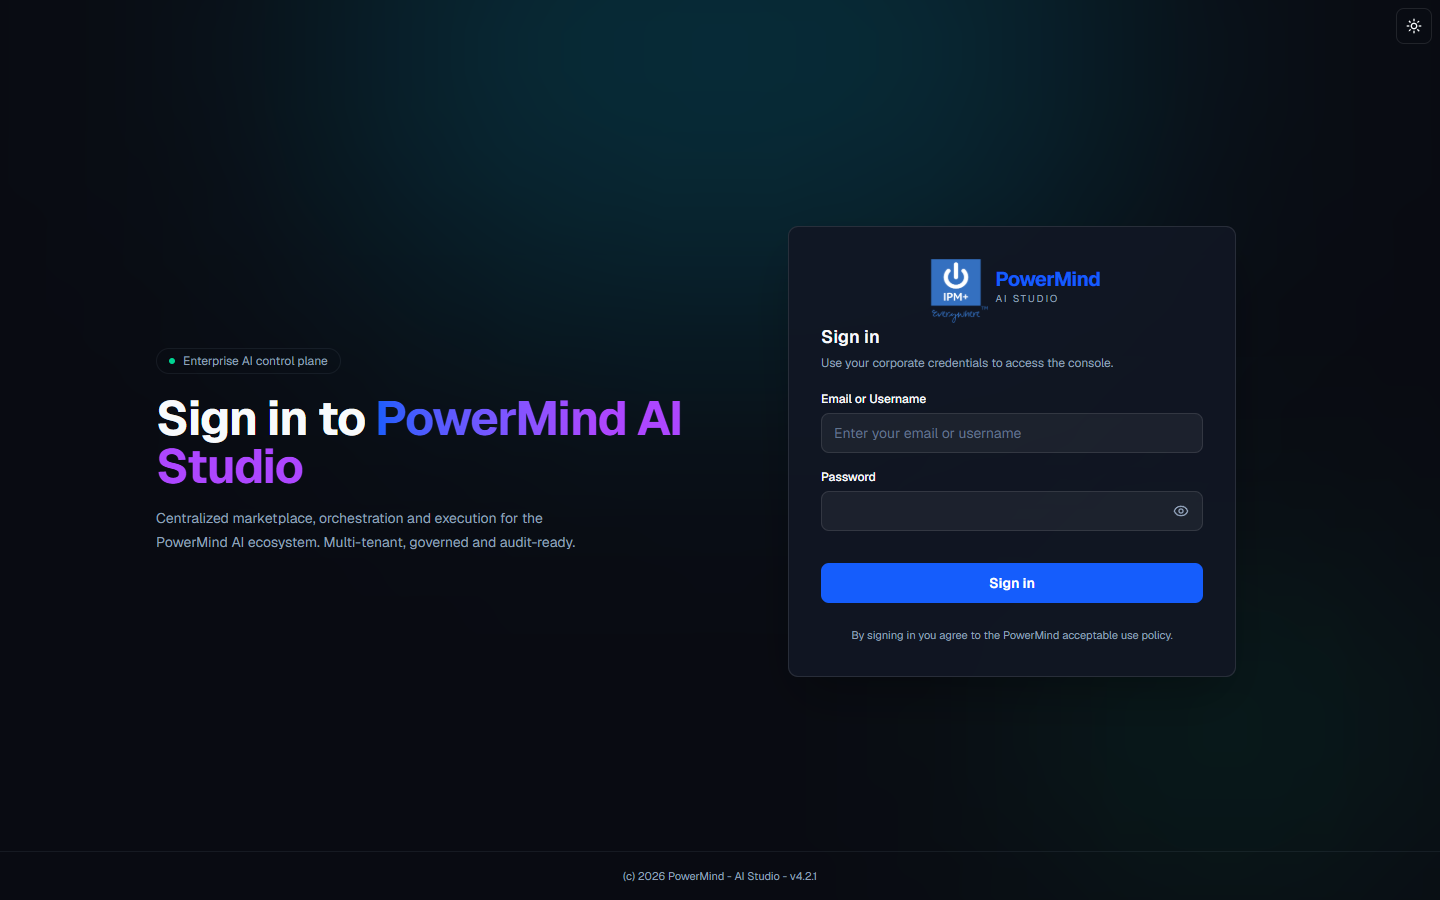
1.2 Enter credentials
On the login form:
- Email or Username -- your Studio account identity
- Password -- your Studio password
- Sign in -- submit and enter the app
After a successful sign-in you are redirected into the Studio shell, where you can select a project and open tools.
2. Select a project and open Trace from Tool Marketplace
2.1 Select the Studio project
In the Studio shell, choose the Studio project that owns the Trace data you care about (the same project used when Dynamics / AIFlow instrumentation was configured). Trace lists stay empty until both a Studio project and a Trace project are selected.
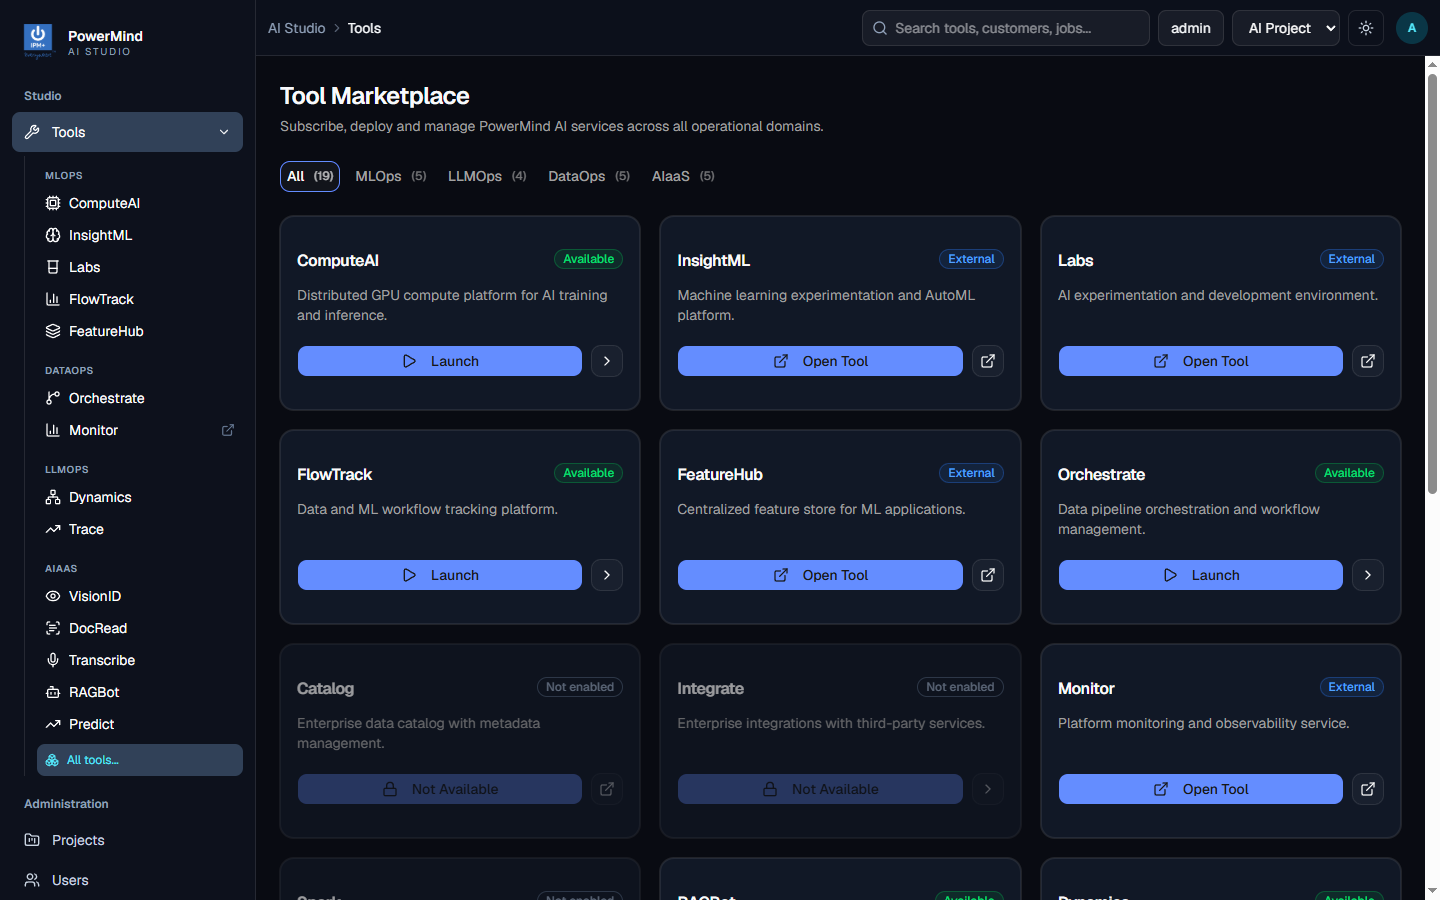
2.2 Open Tool Marketplace
Use either path:
- Sidebar: Tools -> open the marketplace
- Direct route:
/app/tools
You should see the H1 Tool Marketplace.
2.3 Filter by domain (optional)
Domain tabs at the top of the marketplace:
- All
- MLOps
- LLMOps
- DataOps
- AIaaS
Select LLMOps (or leave All) to find the Trace card faster.
2.4 Launch Trace
On the Trace card:
- Title: Trace
- Description: Prompt tracing and token analytics for LLMs.
- Action: Launch
Click Launch to open the Trace explorer at /app/tools/trace.
3. Trace shell: overview and navigation
3.1 Header and tabs
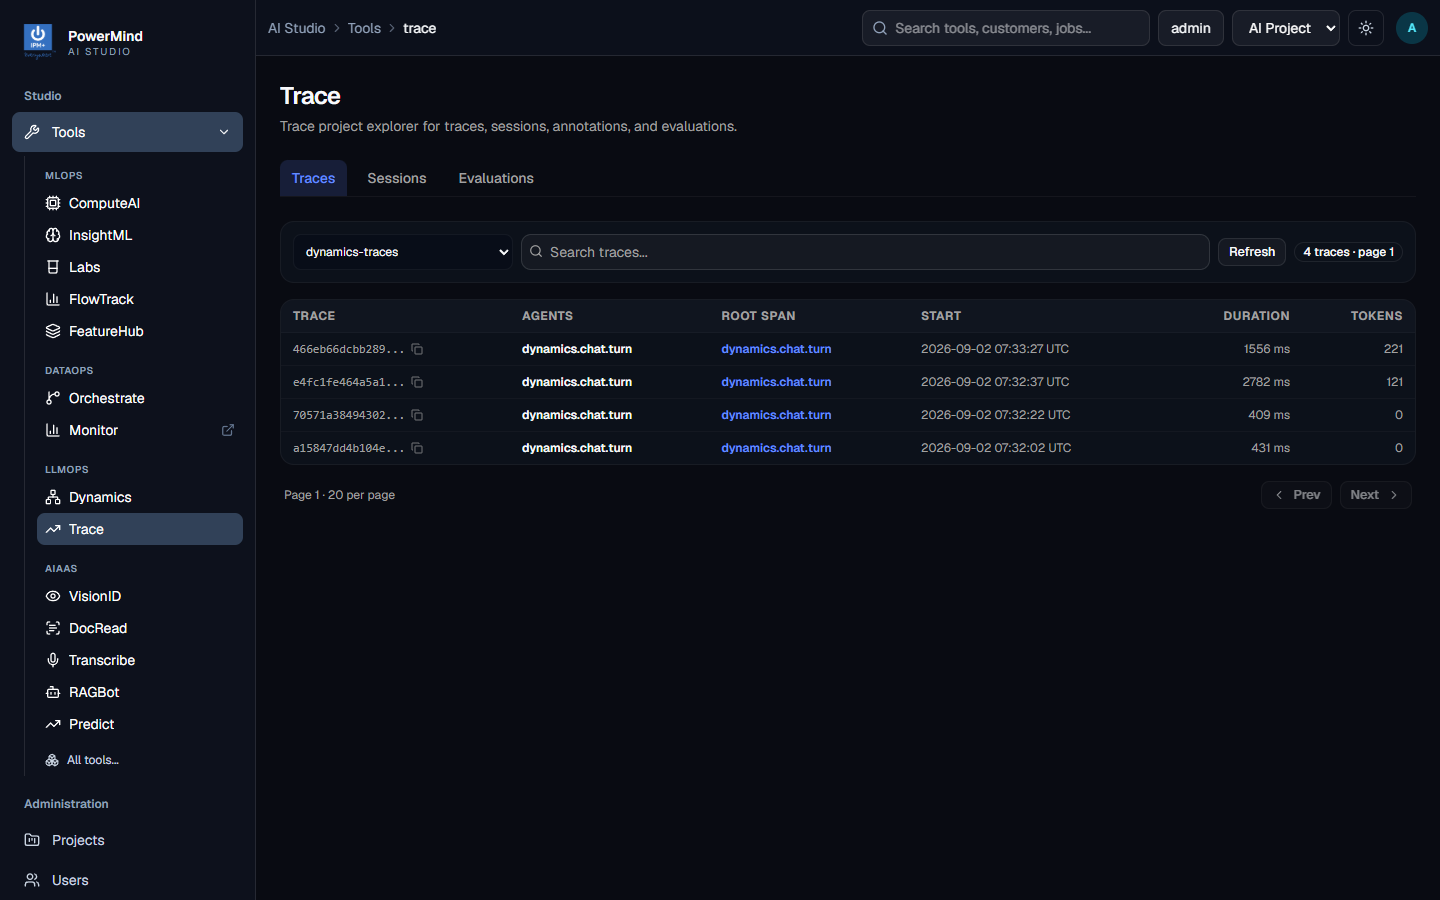
The Trace area shows:
- H1: Trace
- Subtitle: Trace project explorer for traces, sessions, annotations, and evaluations.
- Tabs: Traces | Sessions | Evaluations
| Tab | Route |
|---|---|
| Traces | /app/tools/trace |
| Sessions | /app/tools/trace/sessions |
| Evaluations | /app/tools/trace/evaluations |
3.2 Select a Trace project
On every Trace tab, use the project dropdown:
- Placeholder: Select Trace project...
- Loading state: Loading Trace projects...
- Title attribute: Trace project
Pick the Trace project that received your Dynamics / AIFlow spans. Until a Trace project is selected, tables show guidance such as Select a Trace project to view traces.
4. Traces tab -- browse and inspect
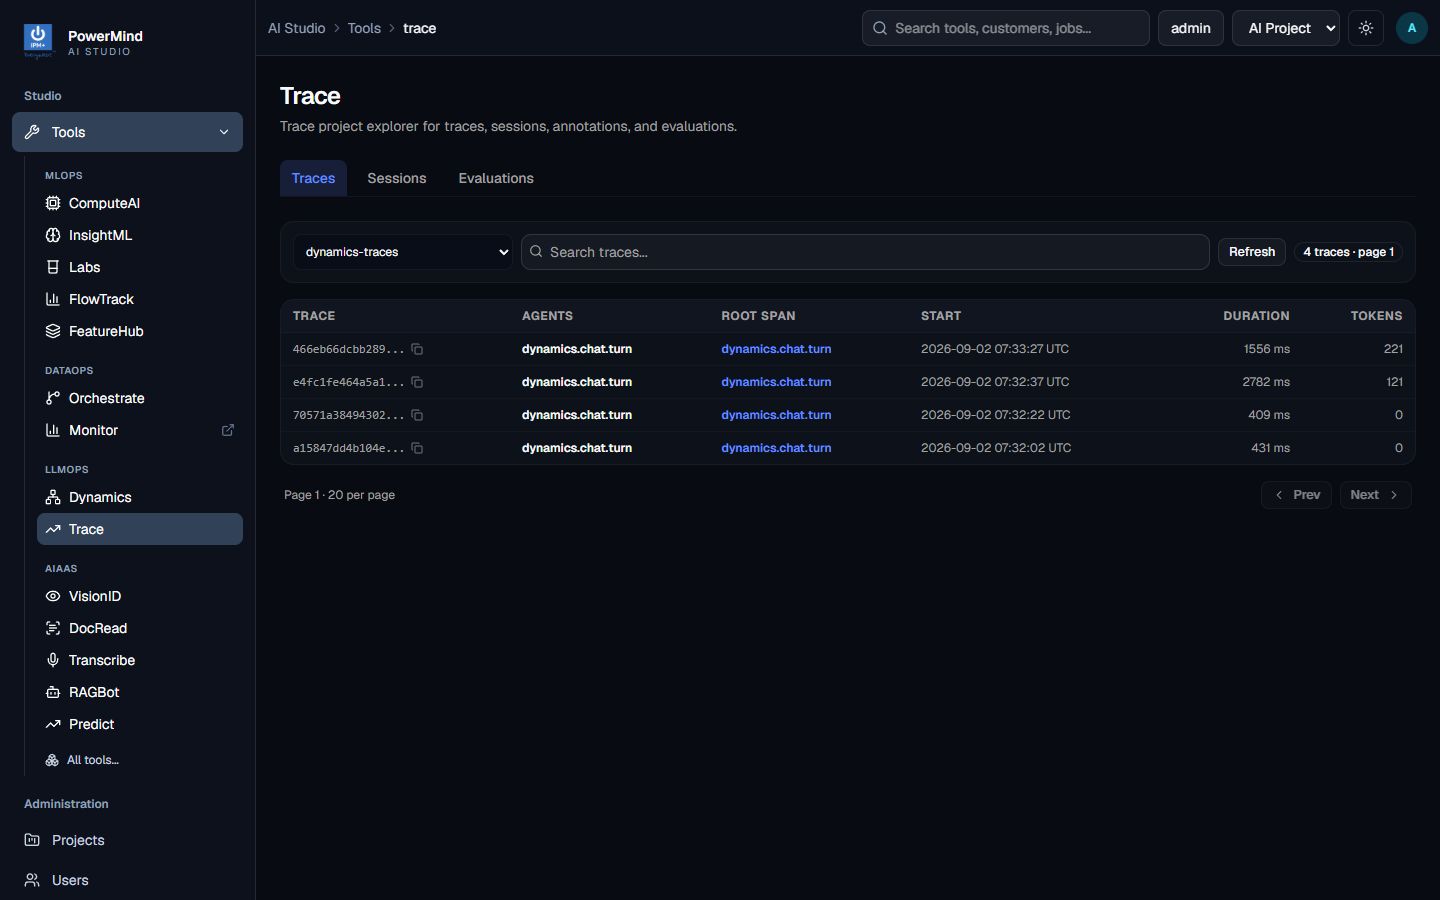
4.1 Toolbar controls
On Traces (/app/tools/trace):
- Select Trace project... -- required scope
- Search traces... -- filter the list
- Refresh -- reload from the server
- Count / page badge when data is loaded
- Optional Session: filter badge (when you arrived from Sessions), with a clear (x) control labeled Clear session filter
4.2 Table columns
| Column | Meaning |
|---|---|
| Trace | Trace id (truncated; click to open detail; copy control available) |
| Agents | Agent name associated with the trace |
| Root Span | Name of the root span |
| Start | Start timestamp (UTC in the UI) |
| Duration | Duration in ms |
| Tokens | Token total for the trace |
Empty state: No traces found. Loading state: Loading traces...
Pagination: Prev / Next (20 per page).
4.3 Trace detail sheet (attrs / input / output)
Click a Trace id to open the right-hand detail sheet.
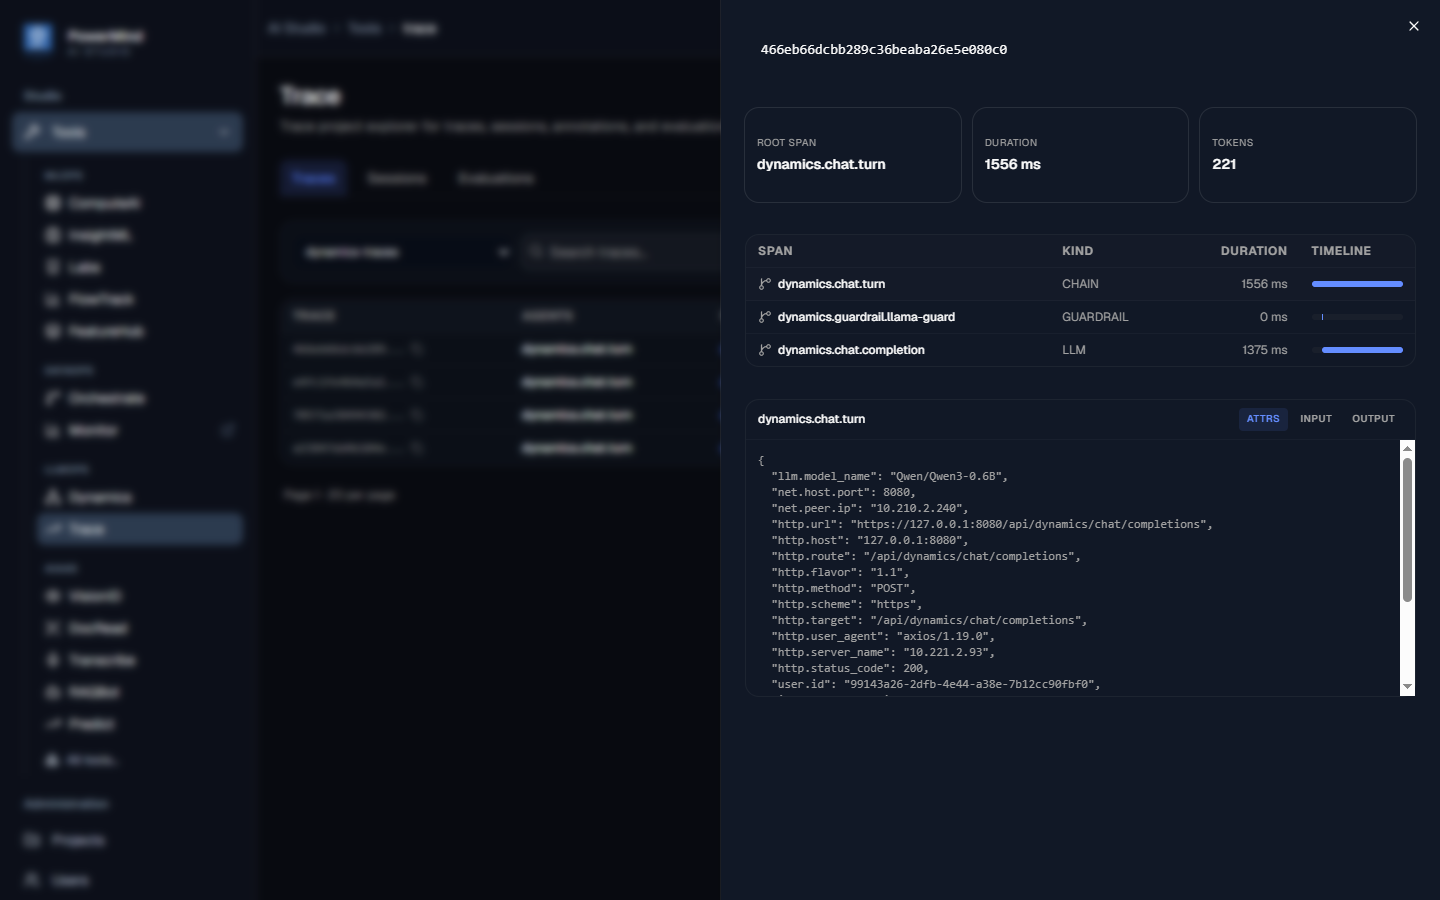
In the sheet you can:
- Confirm Root Span and related summary cards
- Select a span in the span list / waterfall
- Switch the span detail tabs (exact labels):
- attrs -- JSON attributes for the selected span
- input -- span input value (or No input recorded.)
- output -- span output value (or No output recorded.)
Use this view to compare what the agent received versus what it produced after a Dynamics or AIFlow turn.
5. Sessions tab -- conversations and drill-down
5.1 Toolbar controls
On Sessions (/app/tools/trace/sessions):
- Select Trace project...
- Search sessions...
- Refresh
- Delete Selected -- enabled when one or more sessions are selected
- Sessions count badge when scoped
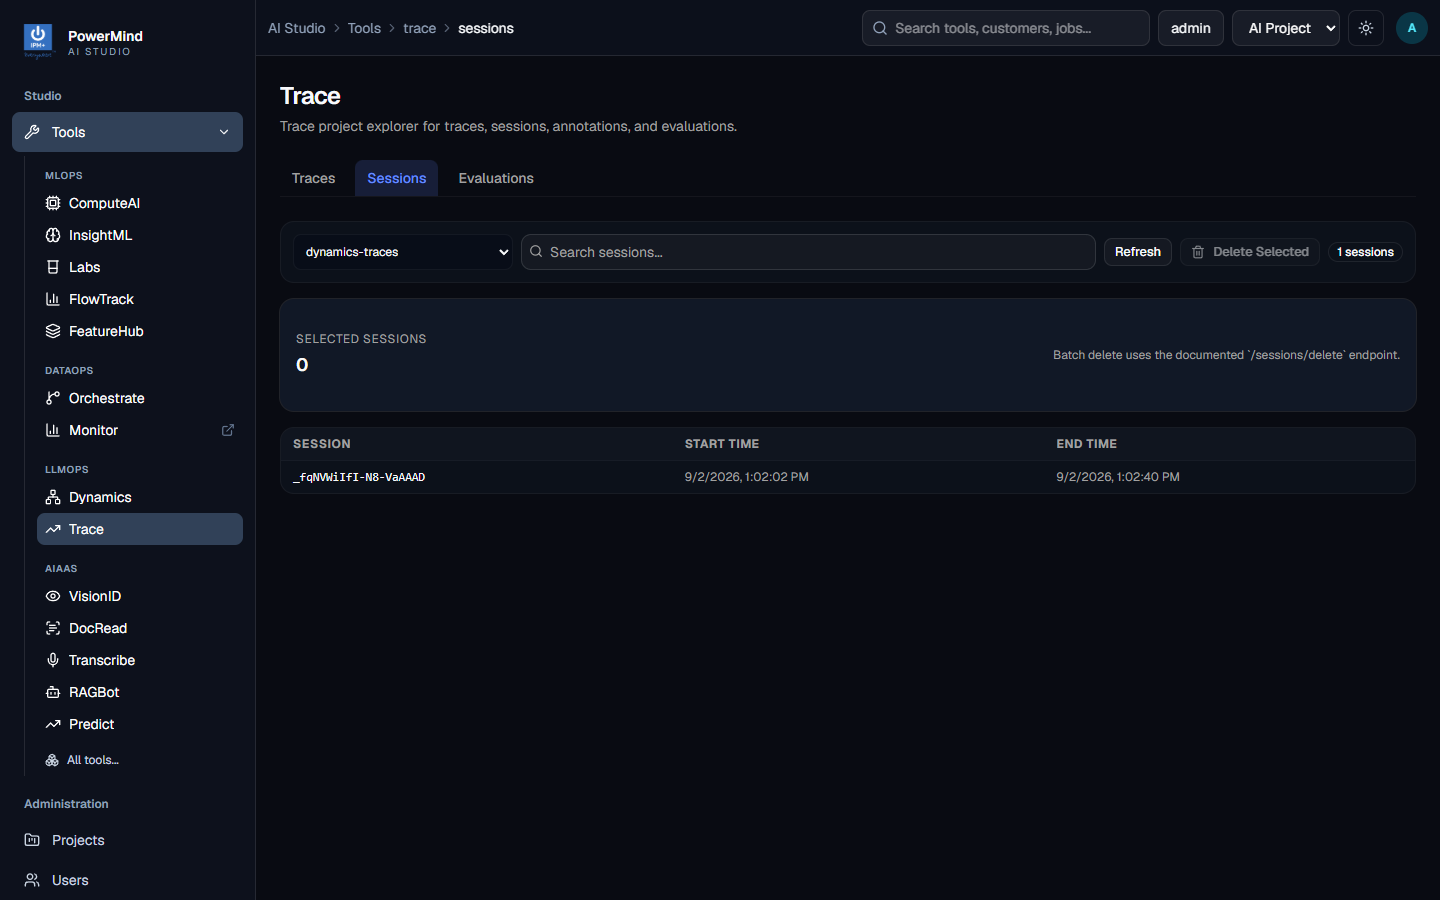
5.2 Table columns
| Column | Meaning |
|---|---|
| Session | Session identifier / label |
| Start Time | Session start |
| End Time | Session end |
Empty state: No sessions found. Loading state: Loading sessions...
A Selected Sessions summary card shows how many rows are checked before batch delete.
5.3 Open a session into Traces
Opening a session navigates to Traces with a Session filter applied (same Trace project preserved). You then see only the traces that belong to that conversation--ideal when debugging one Dynamics chat thread.
Clear the Session badge on the Traces toolbar when you want the full project list again.
6. Evaluations tab -- run rubrics in Studio
6.1 Scope and run controls
On Evaluations (/app/tools/trace/evaluations):
- Choose Select Trace project...
- Set All agents (or pick a specific agent)
- Choose Select rubric
- Choose the window: Last 10 / Last 20 / Last 30 / Last 40 / Last 50
- Click Refresh to reload listed results, or Run eval to score the selected window
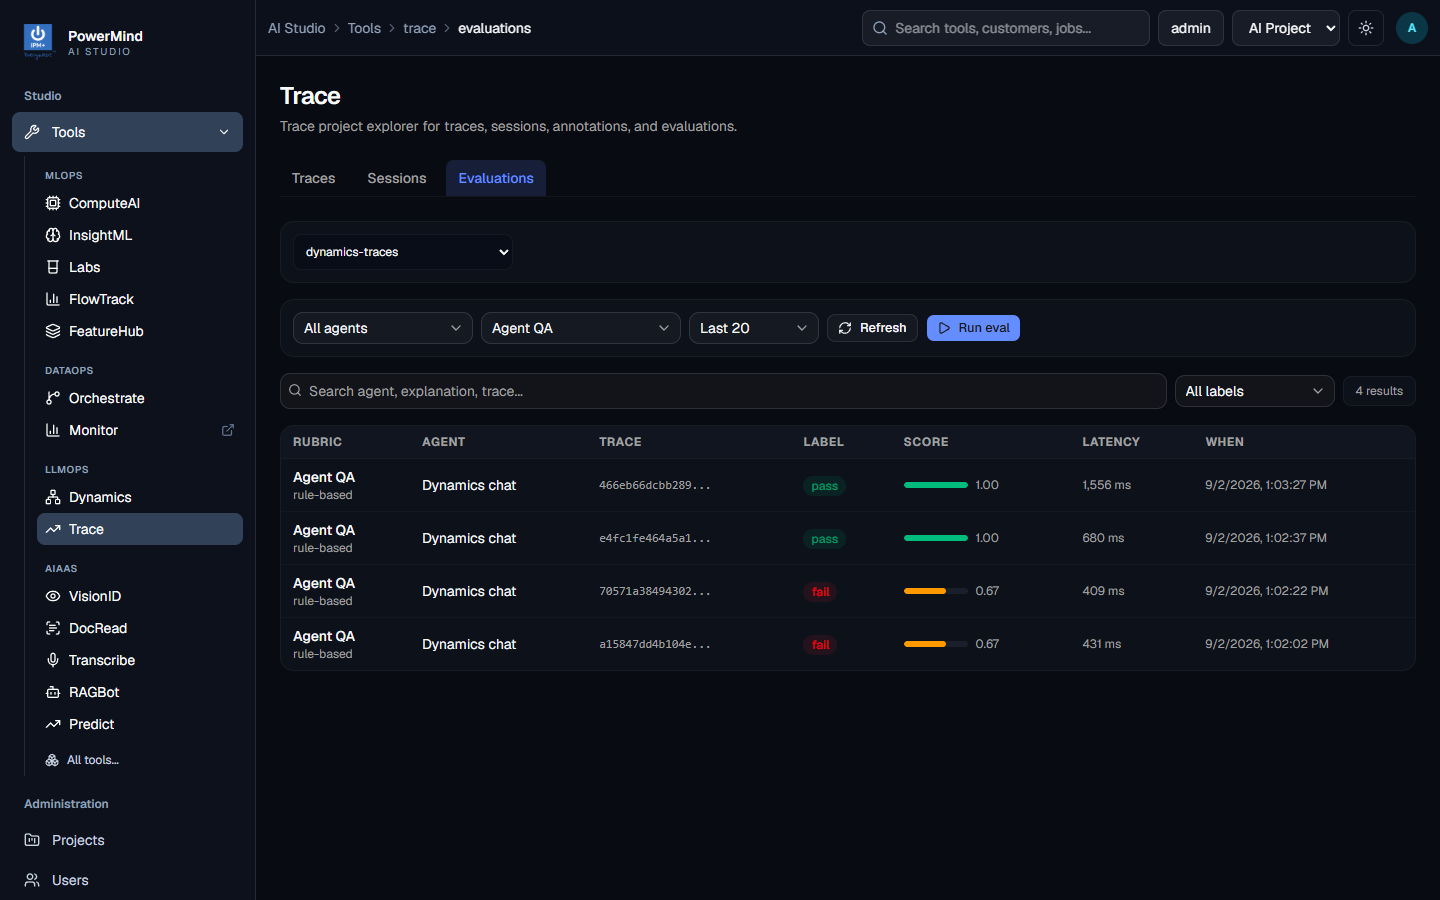
Additional filters after results load:
- Search agent, explanation, trace...
- All labels (label filter)
6.2 Available rubrics
Use the Select rubric dropdown. Platform packs include:
| Rubric id | Display name | Typical focus |
|---|---|---|
agent-qa |
Agent QA | Baseline agent QA (latency, answer present, no error) |
agent-qa-strict |
Agent QA (strict) | Stricter latency / QA bar |
production-health |
Production Health | Broader production readiness checks |
safety-focused |
Safety focused | Guardrail / safety oriented |
latency-sla |
Latency SLA | Latency SLA checks |
completeness |
Completeness | Input/output completeness |
answer-quality-llm |
Answer Quality | LLM-judge answer quality (relevance / hallucination) |
6.3 Results table
| Column | Meaning |
|---|---|
| Rubric | Rubric / evaluator name (model shown when present) |
| Agent | Target agent |
| Trace | Related trace id |
| Label | Pass / fail style label |
| Score | Numeric score (UI shows a percentage bar) |
| Latency | Evaluation / trace latency signal |
| When | When the evaluation was recorded |
Empty state: No evaluations found. Loading state: Loading evaluations...
After Run eval, review Label and Score for the traces that worried you, then jump back to Traces to open the matching detail sheet (attrs / input / output) and confirm the fix.
7. End-to-end Studio checklist (Dynamics / AIFlow debug)
- Sign in at
/login-> Email or Username, Password, Sign in. - Select the correct Studio project.
- Open Tools -> Tool Marketplace (
/app/tools) -> domain LLMOps (optional) -> Trace card (Prompt tracing and token analytics for LLMs.) -> Launch. - Confirm H1 Trace and tabs Traces | Sessions | Evaluations.
- Choose Select Trace project....
- On Sessions, find the conversation -> open it to apply the Session filter on Traces.
- On Traces, open the suspect row -> inspect attrs, input, output.
- On Evaluations, set All agents / Select rubric / Last N -> Run eval -> read Label / Score / Latency / When.
That loop stays entirely inside PowerMind AI Studio--no CLI or SDK required for day-to-day Trace investigation.